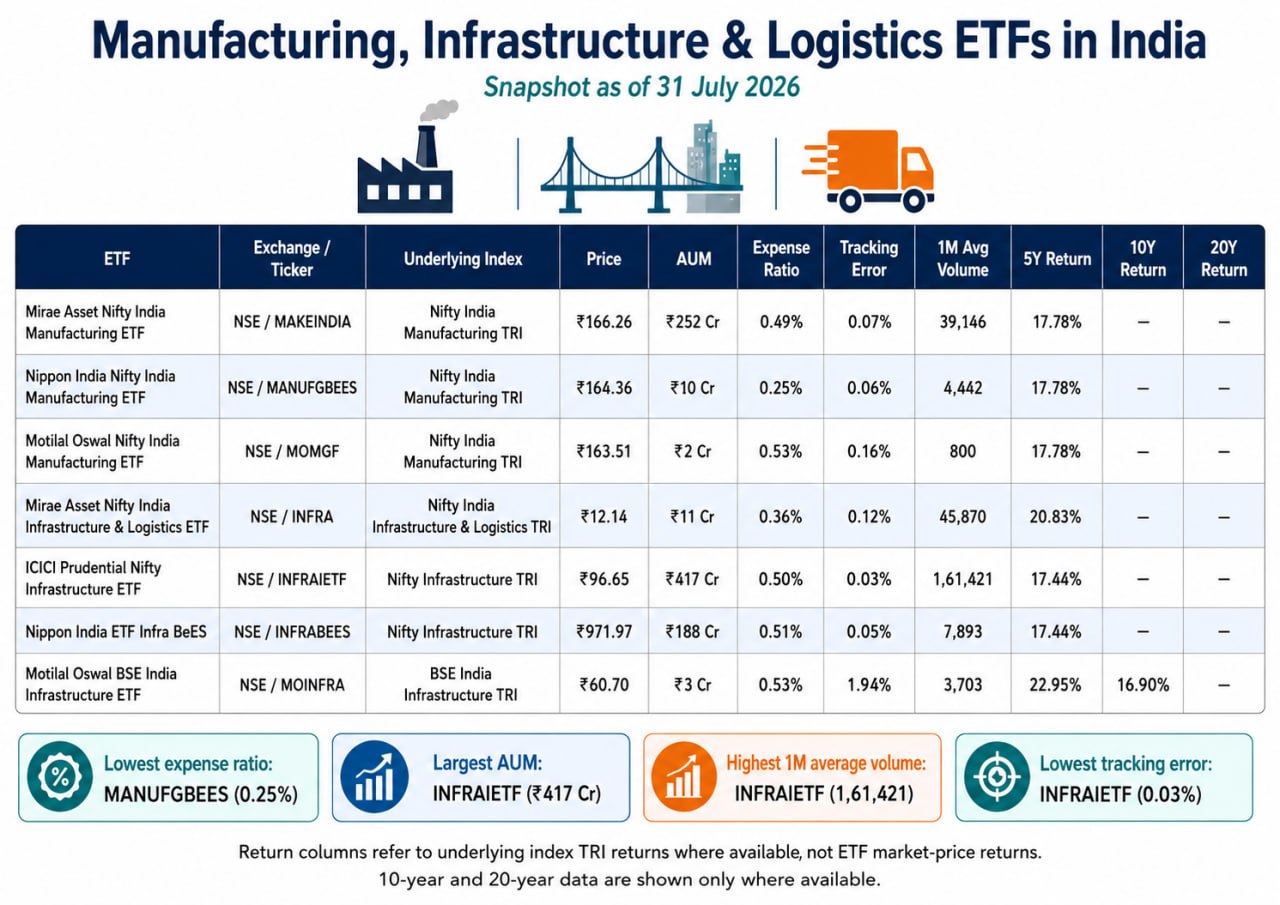
Index structures, listed ETFs and comparative data. Market and index data compiled to 31 July 2026.
India now has multiple passive choices for manufacturing and infrastructure themes. Although several ETFs may appear similar, they may track very different indices: a focused 30-stock infrastructure index, a broad 100-stock infrastructure and logistics index, a 76-stock manufacturing index, or the BSE India Infrastructure Index.
Official index fact sheets:
- Nifty Infrastructure
- Nifty India Infrastructure & Logistics
- Nifty India Manufacturing
- BSE India Infrastructure
1. Underlying Index Comparison
| Index | Primary Focus | Stocks | Weighting / Construction | Rebalancing |
|---|---|---|---|---|
| Nifty India Manufacturing TRI | Diversified Indian manufacturing companies | 76 | Capped free-float market capitalisation; 5% stock cap | Semi-annually |
| Nifty Infrastructure TRI | Telecom, power, ports, roads, railways, air and utilities | 30 | Periodic capped free-float market capitalisation | Semi-annually |
| Nifty India Infrastructure & Logistics TRI | Broad infrastructure and logistics ecosystem | 100 | Capped free-float; 5% stock cap and 20% industry cap | Semi-annually |
| BSE India Infrastructure TRI | Infrastructure companies within the BSE AllCap universe | 29 | Modified market-cap weighted | Semi-annually (March and September) |
2. Total Return Index Performance
| Index | QTD / 3M | YTD | 1 Year | 3 Years | 5 Years | 10 Years | Since Inception |
|---|---|---|---|---|---|---|---|
| Nifty India Manufacturing TRI | 2.99% | 6.66% | 15.78% | — | 17.78% | — | 15.44% |
| Nifty Infrastructure TRI | -0.11% | -1.55% | 4.73% | — | 17.44% | — | 11.79% |
| Nifty India Infrastructure & Logistics TRI | -2.29% | 7.52% | 7.72% | — | 20.83% | — | 13.78% |
| BSE India Infrastructure TRI | 13.56%* | 5.27% | 0.71% | 26.61% | 22.95% | 16.90% | — |
*For BSE India Infrastructure, the first return column is the published 3-month return. Returns above one year are annualised. Fifteen-year and twenty-year figures were not published in the fact sheets.
3. Index Valuation Snapshot
| Index | P/E | P/B | Dividend Yield |
|---|---|---|---|
| Nifty India Manufacturing TRI | 28.44 | 4.25 | 1.00% |
| Nifty Infrastructure TRI | 23.14 | 2.84 | 1.10% |
| Nifty India Infrastructure & Logistics TRI | 29.56 | 4.17 | 0.81% |
| BSE India Infrastructure TRI | 18.49 | 3.03 | 1.43% |
4. Listed ETF Comparison
Seven ETFs across four underlying indices.
| ETF | NSE Ticker | Underlying Index | Price | 1M Avg. Volume | AUM | TER | Track. Error | 1Y Return |
|---|---|---|---|---|---|---|---|---|
| Mirae Asset Nifty India Manufacturing ETF | MAKEINDIA | Nifty India Manufacturing TRI | ₹166.26 | 39,146 | ₹252 Cr | 0.49% | 0.07% | 12.20% |
| Nippon India Nifty India Manufacturing ETF | MANUFGBEES | Nifty India Manufacturing TRI | ₹164.36 | 4,442 | ₹10 Cr | 0.25% | 0.06% | N/A |
| Motilal Oswal Nifty India Manufacturing ETF | MOMGF | Nifty India Manufacturing TRI | ₹163.51 | 800 | ₹2 Cr | 0.53% | 0.16% | 9.92% |
| Mirae Asset Nifty India Infrastructure & Logistics ETF | INFRA | Nifty India Infra & Logistics TRI | ₹12.14 | 45,870 | ₹11 Cr | 0.36% | 0.12% | N/A |
| ICICI Prudential Nifty Infrastructure ETF | INFRAIETF | Nifty Infrastructure TRI | ₹96.65 | 1,61,421 | ₹417 Cr | 0.50% | 0.03% | 2.74% |
| Nippon India ETF Infra BeES | INFRABEES | Nifty Infrastructure TRI | ₹971.97 | 7,893 | ₹188 Cr | 0.51% | 0.05% | 1.10% |
| Motilal Oswal BSE India Infrastructure ETF | MOINFRA | BSE India Infrastructure TRI | ₹60.70 | 3,703 | ₹3 Cr | 0.53% | 1.94% | 0.28% |
Data note: Market prices are closing references around 31 July 2026. AUM, expense ratio and tracking error are the latest values available around the cut-off date. Volume is the one-month average daily volume, which is more useful than a single day's volume. The reported one-year ETF return is market-price based and may differ from the AMC's official NAV return. N/A indicates that the ETF had not completed a full one-year history at the cut-off date.
5. What the Comparison Shows
- Largest AUM: ICICI Prudential Nifty Infrastructure ETF has the largest fund size in this group at approximately ₹417 crore.
- Lowest expense ratio: Nippon India Nifty India Manufacturing ETF has the lowest reported TER in this comparison at 0.25%.
- Best trading liquidity: ICICI Prudential Nifty Infrastructure ETF has the highest one-month average volume, followed by Mirae Asset INFRA and MAKEINDIA.
- Tracking quality: ICICI Prudential INFRAIETF reports the lowest tracking error at 0.03%. MOINFRA's reported tracking error is much higher and deserves closer review.
Important Interpretation
- A low expense ratio is useful, but it should not be assessed in isolation. A thinly traded ETF with a wide bid-ask spread may cost more during purchase or sale.
- AUM reflects the size of the scheme, while exchange volume reflects trading activity. These are related but are not the same measure.
- Tracking error indicates the consistency of index replication. Tracking difference shows the actual return gap after expenses; both should be reviewed.
- The market price of one ETF unit does not indicate whether the ETF is cheap or expensive. Compare the underlying index, NAV/iNAV, valuation and portfolio structure.
- Use limit orders, particularly for ETFs with low average volume, to reduce the risk of buying at a large premium or selling at a discount.
6. Which Index Is More Diversified?
| Index | Companies | Key feature | |
|---|---|---|---|
| Most focused | Nifty Infrastructure | 30 | Large weights in Reliance, Bharti Airtel and Larsen & Toubro |
| Broadest infrastructure | Nifty India Infrastructure & Logistics | 100 | 5% stock cap and 20% industry cap |
| Broad manufacturing | Nifty India Manufacturing | 76 | No stock above 5% under the stated methodology |
7. Sector Exposure and Top Holdings
Nifty India Manufacturing
Major sectors: Auto & components 26.95%; Capital goods 23.54%; Healthcare 17.89%; Metals & mining 12.79%
Top five holdings: Mahindra & Mahindra 5.39%; Sun Pharma 4.95%; Reliance Industries 4.84%; Maruti Suzuki 4.36%; Tata Steel 3.68%
Nifty Infrastructure
Major sectors: Oil, gas & fuels 27.80%; Telecom 16.94%; Construction 12.01%; Power 10.50%
Top five holdings: Reliance Industries 20.04%; Bharti Airtel 15.62%; Larsen & Toubro 12.01%; NTPC 4.29%; UltraTech Cement 3.67%
Nifty India Infrastructure & Logistics
Major sectors: Capital goods 30.00%; Power 19.70%; Construction materials 11.53%; Services 11.18%
Top five holdings: Bharti Airtel 5.34%; NTPC 4.94%; Larsen & Toubro 4.79%; UltraTech Cement 4.32%; Bharat Electronics 4.26%
BSE India Infrastructure
Major sectors: Utilities 30.38%; Industrials 29.24%; Services 21.18%; Energy 10.87%; Financial services 8.33%
Top five holdings: Larsen & Toubro 10.07%; Adani Ports 9.02%; NTPC 8.80%; InterGlobe Aviation 8.14%; Power Grid 6.56%
8. How to Choose Between These ETFs
- Choose the index first: Decide whether you want manufacturing, focused infrastructure, broad infrastructure and logistics, or the BSE infrastructure basket.
- Review concentration: A 30-stock index with large single-stock weights behaves differently from a capped 76-stock or 100-stock index.
- Compare implementation: Among ETFs tracking the same index, compare expense ratio, tracking error, AUM, average volume and bid-ask spread.
- Check price versus iNAV: Avoid paying a large premium to the indicative NAV, especially in a less liquid ETF.
- Use thematic exposure carefully: Manufacturing and infrastructure are cyclical themes. They are generally more suitable as a limited satellite allocation than as the entire equity portfolio.
9. Key Risks
- Economic-cycle risk: capital expenditure, construction demand, industrial production and commodity prices can change sharply.
- Concentration risk: a few large holdings may drive a substantial part of index performance.
- Valuation risk: the broader manufacturing and infrastructure-logistics indices were trading at higher P/E and P/B multiples than the BSE infrastructure index at the reported dates.
- ETF trading risk: low liquidity or a wide spread can cause the traded price to differ from NAV, even when the underlying index is unchanged.
- Historical returns are not forecasts. Strong five-year or ten-year index returns do not guarantee similar future performance.
Data and Source Notes
- Nifty index composition, returns and valuation data: official NSE Indices fact sheets dated 31 July 2026.
- BSE India Infrastructure data: official BSE Indices fact sheet dated 30 June 2026.
- ETF prices and comparison metrics: NSE/AMC pages and ETF comparison portals available around 31 July 2026.
- ETF AUM, TER, tracking error and volumes can change. Confirm the latest AMC fact sheet and exchange data before investment.
Official links: Nifty Indices | BSE Indices | NSE ETF Market Data
Disclaimer: This article is for financial education only and is not investment advice. ETFs and thematic indices are market-linked and may result in loss of capital. Read the official scheme documents and consult a qualified adviser where required.
Download: PDF version of this article (includes the original charts and screenshots).