Wealth creation does not always require complicated strategies, frequent trading or chasing the latest theme. A simple, disciplined approach using broad market indices can be enough for long-term goals. The key is to start early, invest regularly through a monthly systematic investment plan, continue through market cycles and, when suitable for one’s risk capacity, add more during meaningful market corrections.
A simple market-cap framework can cover almost the entire Indian equity market. Large caps can be represented by the Nifty 50, Nifty 100 and Nifty Next 50 (often called Junior Nifty). Mid caps are represented by the Nifty Midcap 150; small caps by the Nifty Smallcap 250; and micro caps by the Nifty Microcap 250. For investors who prefer one broad basket, the Nifty 500 covers large-, mid- and small-cap companies, while the Nifty Total Market combines the Nifty 500 and Nifty Microcap 250, giving exposure to 750 stocks across the market-cap spectrum.
Why keep these indices in mind? Large caps can provide a relatively steadier core. Mid caps can add growth with higher volatility. Small caps can offer greater growth potential but may experience deeper corrections and longer recovery periods. Micro caps can be even more volatile and therefore need a very long horizon and strong risk tolerance. The Nifty 500 or Nifty Total Market reduces the need to guess which market-cap segment will lead next.
Return snapshot (Total Return Index): as of 17 September 2026, the 1-, 3-, 5-, 7-, 10- and 15-year annualized returns were approximately: Nifty 100: -5.2%, 7.8%, 7.6%, 13.4%, 11.8%, 12.6%; Nifty Midcap 150: 4.0%, 14.7%, 15.8%, 22.6%, 16.9%, 17.8%; Nifty Smallcap 250: 3.7%, 14.2%, 15.0%, 22.6%, 14.7%, 15.3%; and Nifty 500: -2.5%, 9.7%, 9.7%, 15.5%, 12.9%, 13.4%. Twenty-year CAGRs to 31 July 2026 were about 12.6%, 16.6%, 14.3% and 13.0% respectively. The supplied market-cap study also shows a 10-year CAGR of 21.9% for micro caps, highlighting both their wealth-creation potential and their much higher year-to-year swings.
The inference is simple: no segment wins every year, but patience and diversification can allow compounding to work. A long-term investing culture—regular SIPs, avoiding panic during corrections, adding prudently on dips, and teaching financial literacy early—can be more important than finding the next ‘perfect’ product. Broad-based indices, used with discipline and adequate time, can be more than enough for many long-term goals.
Note: Index returns are point-to-point Total Return Index returns, not SIP returns. Past performance does not guarantee future returns. This material is for education only and is not investment advice.
Sources: NSE Indices; BMSMoney return snapshots dated 17 September 2026; FundsIndia/Ace MF data dated 31 July 2026; user-supplied market-cap return chart dated 8 September 2026.
Back to Blog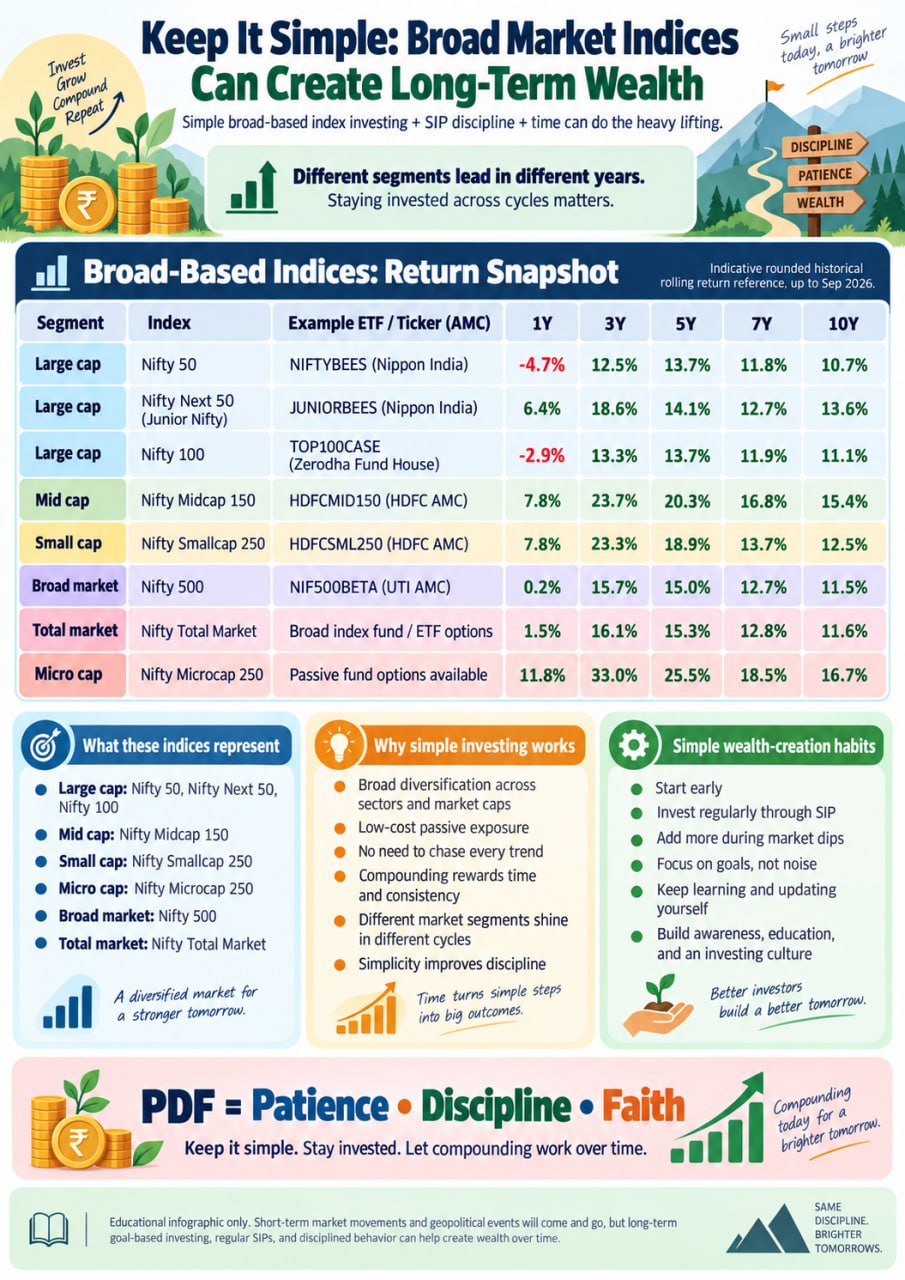
DP
Written by
Dr Pankaj Nandlal Tardeja
Pediatrician and Neonatologist, Al Ain , Abu Dhabi, UAE
Editorial Standards & Research Methodology →