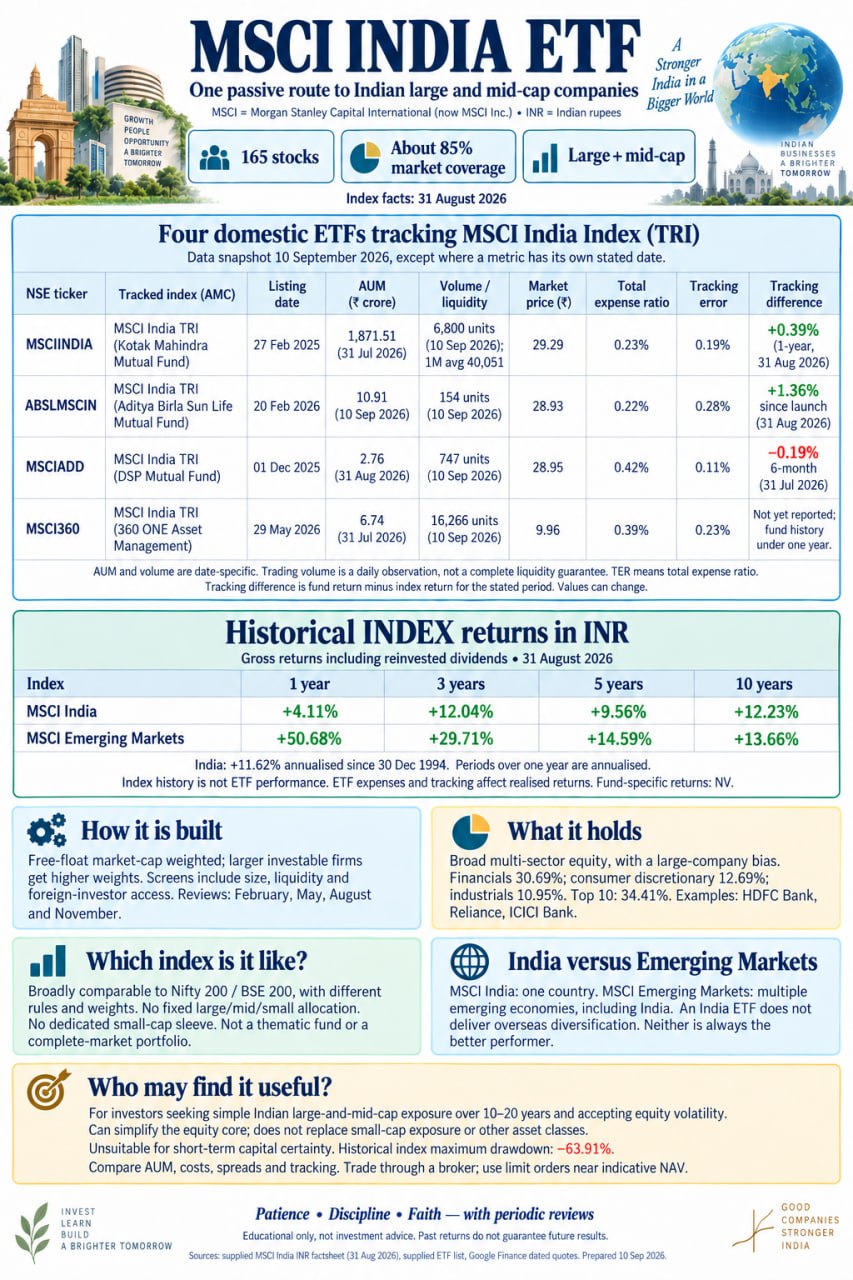
The MSCI factsheet dated 31 August 2026 records 165 constituents covering approximately 85% of the Indian equity universe. Constituents and weights change over time. Selection considers company size, liquidity, free float and foreign-investor accessibility. Weighting uses free-float-adjusted market capitalisation, so larger investable companies carry greater weight. Scheduled reviews occur in February, May, August and November, with corporate-event adjustments between reviews.
This is a broad, multi-sector, large-and-mid-cap index with a large-company bias, rather than an equal-weight, sector or small-cap strategy. Financials represent 30.69%, and the top ten holdings 34.41%, including HDFC Bank, Reliance Industries and ICICI Bank. Nifty 200 and BSE 200 are useful broad comparisons, although selection rules and weights differ. It is broader by stock count than Nifty 50 or Nifty 100, but does not replicate Nifty Midcap 150, Nifty Smallcap 250 or a complete-market portfolio. MSCI size classifications also differ from Indian fund-category classifications.
4 domestic ETFs: MSCIINDIA (Kotak Mutual Fund), ABSLMSCIN (Aditya Birla Sun Life Mutual Fund), MSCIADD (DSP Mutual Fund) and MSCI360 (360 ONE Mutual Fund). These are MSCI India offerings; the total-return benchmark includes reinvested dividends. Current assets under management, expense ratios, exchange prices, numerical trading volumes, tracking errors, tracking differences and individual ETF returns could not be independently verified for this article. Consequently, no largest-fund ranking or estimated figures are presented. Tracking difference measures fund return minus benchmark return; tracking error measures variability of that gap.
As at 31 August 2026, the supplied index factsheet reports gross rupee returns of +4.11% over one year; annualised returns of +12.04% over three years, +9.56% over five years, +12.23% over ten years and +11.62% since 30 December 1994. The index launched on 30 April 1993; the reported long-history return starts later. These include reinvested dividends before fund expenses and are not ETF returns. The historical maximum drawdown was 63.91%, demonstrating substantial equity risk.
For investors accepting equity volatility over 10–20 years, one such ETF can simplify large-and-mid-cap exposure. It cannot replace deliberate small-cap exposure or diversification into other assets. Units trade through a broker during exchange hours. Compare dated fund size, costs, tracking and bid–ask spreads; volume alone is not liquidity. Use limit orders near indicative net asset value. Regular investing and periodic reviews support patience, discipline and faith, but neither long holding periods nor systematic purchases guarantee profits. Educational information only; not investment advice.
Sources: Supplied MSCI India Index INR gross-return factsheet, 31 August 2026; supplied ETF screenshot; MSCI index profile