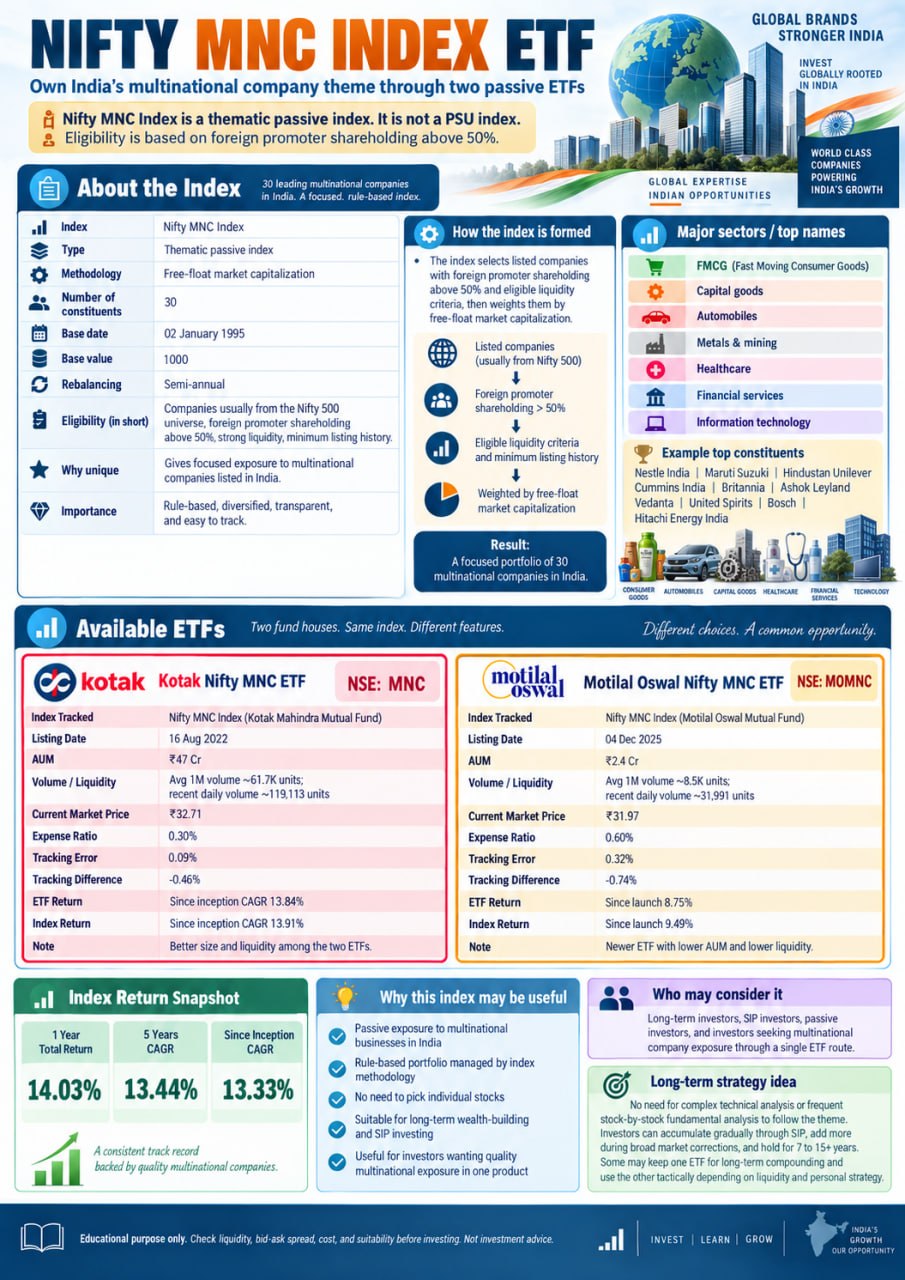
The Nifty MNC Index is a thematic passive index from NSE Indices. It is not a PSU index: the key eligibility condition is foreign promoter shareholding above 50%, not FII holding above 50%. As of 31 August 2026, it had 30 constituents. It uses free-float market capitalization, is calculated in real time, has a base date of 2 January 1995 and base value of 1,000, and is rebalanced semi-annually. Eligible companies are mainly drawn from the Nifty 500 and must meet liquidity and listing-history requirements.
The portfolio spans consumer, capital goods, automobiles, metals, healthcare, financial services and technology. Major constituents on 31 August 2026 were Nestle India 10.27%, Maruti Suzuki India 9.99%, Hindustan Unilever 8.91%, Cummins India 6.60%, Britannia Industries 5.92%, Ashok Leyland 4.81%, Vedanta 4.52%, United Spirits 4.21%, Bosch 4.15% and Hitachi Energy India 4.11%. The Nifty MNC Total Return Index returned 14.03% over one year, 13.44% CAGR over five years and 13.33% CAGR since its base date.
Kotak Nifty MNC ETF (NSE: MNC; Kotak Mahindra Mutual Fund) was allotted on 5 August 2022 and listed on 16 August 2022. AUM was about ₹47 crore on 31 August 2026. Market price was ₹32.71 on 11 September 2026; latest-day volume was 119,113 units and recent one-month average volume about 61,700 units. Total expense ratio is 0.30%. August 2026 tracking error was about 0.09% and one-year tracking difference about -0.46 percentage point. Since inception to 31 August 2026, the ETF delivered 13.84% CAGR versus 14.27% for the Nifty MNC TRI.
Motilal Oswal Nifty MNC ETF (NSE: MOMNC; Motilal Oswal Mutual Fund) was allotted on 1 December 2025 and listed on 4 December 2025. AUM was about ₹2.36–₹2.47 crore in July-August 2026. Market price was about ₹31.97; one-month average volume was around 8,533 units and recent live volume around 31,991 units, so liquidity is lower. Total expense ratio is about 0.60% and tracking error about 0.32%. By 31 August 2026, ₹10,000 from launch had become about ₹10,875, an 8.75% absolute gain, versus about ₹10,949 or 9.49% for the benchmark; the interim return gap was about -0.74 percentage point.
For investors specifically seeking the MNC theme, this can suit a 7-15+ year horizon. Stock-by-stock fundamental or technical analysis is not required to follow the index, but suitability, valuation, liquidity, cost and tracking quality still matter. A disciplined SIP-style approach, with additional buying during broad market declines, can suit long-term investors. If using both ETFs, one may be kept for long-term accumulation and the other for tactical trading, while remembering that frequent trading adds spread, brokerage, tax and timing risk.
Educational content only; not investment advice. Data referenced from NSE Indices, NSE, Kotak Mutual Fund, Motilal Oswal Mutual Fund and market-data platforms as of the dates stated.