Two exchange traded funds offer a rules based way to own companies across sectors without choosing a single sector yourself. Their selection rules differ: UTI follows company size within BSE 500 sectors, while Mirae Asset adds environmental, social and governance screening within the Nifty 100.
UTI BSE India Sector Leaders ETF
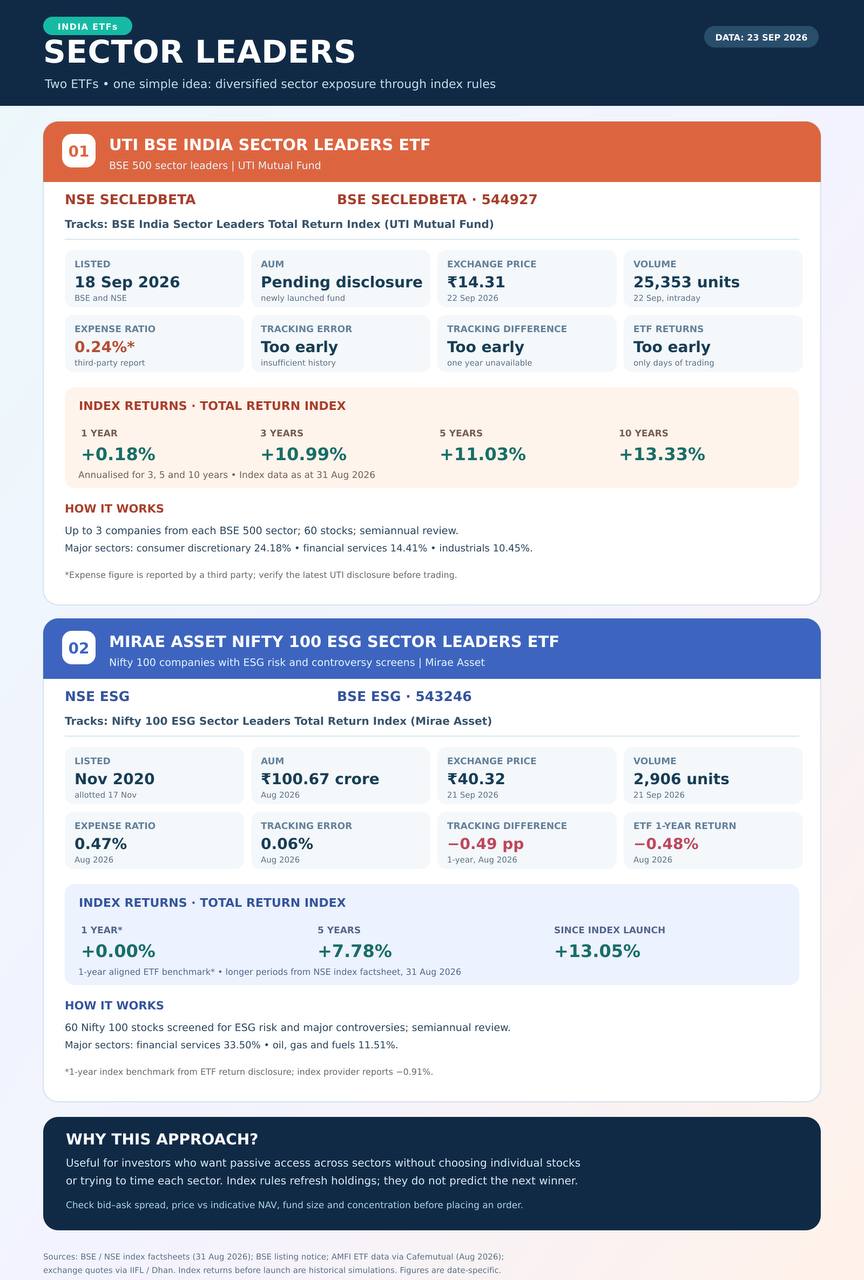
UTI BSE India Sector Leaders Exchange Traded Fund, traded as SECLEDBETA, listed on both BSE and NSE on 18 September 2026. It follows the BSE India Sector Leaders Total Return Index. At each semiannual review, the index selects up to three companies from each BSE 500 sector using average six month market capitalisation. Its 60 constituents are weighted by free float market value, with individual weights capped between 1% and 5% at quarterly capping. As at 31 August, consumer discretionary was 24.18%, financial services 14.41% and industrials 10.45%; leading holdings included ICICI Bank, Bharti Airtel and Reliance Industries. The ETF traded around ₹14.31 on 22 September. Its short trading history does not yet support meaningful one year ETF returns or tracking difference.
The BSE index factsheet of 31 August 2026 reports total returns of 0.18% over one year, 10.99% annualised over three years, 11.03% over five years and 13.33% over ten years. The index launched only in January 2025, so longer periods use historical index data and are not live ETF returns.
Mirae Asset Nifty 100 ESG Sector Leaders ETF
Mirae Asset Nifty 100 ESG Sector Leaders ETF, NSE ticker ESG and BSE code 543246, was allotted on 17 November 2020 and listed later that month. It tracks the Nifty 100 ESG Sector Leaders Total Return Index. Eligible companies must manage environmental, social and governance risks well and avoid major controversies; the index selects companies across Nifty 100 sectors, holds 60 stocks and caps each stock at 10%. Financial services weighed 33.50% and oil, gas and consumable fuels 11.51% on 31 August 2026.
As at August 2026, ETF assets were approximately ₹100.67 crore, the expense ratio was 0.47% annually, tracking error was 0.06%, and the one year tracking difference was −0.49 percentage points (ETF return minus index return). On 21 September, its exchange price was ₹40.32 with 2,906 units traded. The Nifty index factsheet of 31 August reports total returns of −0.91% for one year, 7.78% annualised for five years and 13.05% annualised since its June 2020 launch; longer history uses its 2014 base date.
Why the approach may appeal
Both indices periodically refresh holdings across sectors, reducing the need to identify the next winning sector or time each rotation. They still follow fixed rules, not market forecasts. Before buying, compare exchange price with indicative net asset value and check bid–ask spread, volume, concentration and costs. Past index returns do not predict ETF returns.
Data dates: index factsheets 31 August 2026; ETF statistics August 2026; exchange prices as dated above.