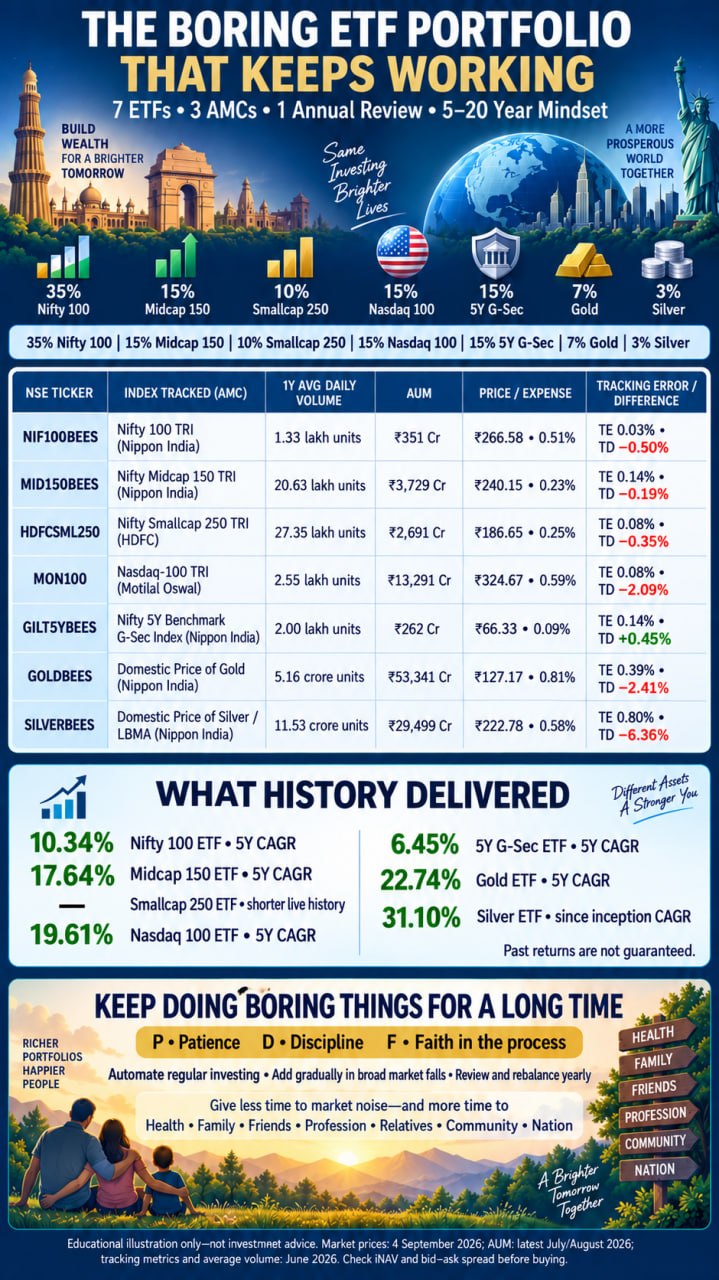
A long-term portfolio need not be complicated. Seven exchange-traded funds can combine Indian large-, mid- and small-cap growth, United States innovation, government debt, gold and silver. An illustrative allocation is 35% Nifty 100, 15% Nifty Midcap 150, 10% Nifty Smallcap 250, 15% Nasdaq 100, 15% five-year Government Securities, 7% gold and 3% silver.
- NSE: NIF100IETF - ICICI Prudential Nifty 100 ETF, tracking the Nifty 100 Total Return Index; listed 10 August 2021. Snapshot on 4 September 2026: assets under management about Rs 161 crore, market price Rs 28.05, average volume about 90,800 units, medium liquidity and tracking error about 0.04%. Tracking difference was not separately displayed in the latest public snapshot.
- NSE: MID150BEES - Nippon India ETF Nifty Midcap 150, tracking the Nifty Midcap 150 Total Return Index; listed 31 January 2019. Assets about Rs 3,599 crore, price Rs 240.15, one-month average volume about 880,000 units, high liquidity, expense ratio about 0.23% and tracking error about 0.15%. Latest comparable tracking difference was not separately disclosed.
- NSE: HDFCSML250 - HDFC Nifty Smallcap 250 ETF, tracking the Nifty Smallcap 250 Total Return Index; listed 23 February 2023. Assets about Rs 2,604 crore, price Rs 186.65, healthy liquidity, expense ratio about 0.26% and tracking error about 0.08%. Tracking difference should be checked in the current AMC factsheet.
- NSE: MON100 - Motilal Oswal Nasdaq 100 ETF, tracking the Nasdaq-100 Total Return Index; listed 29 March 2011. Assets about Rs 13,291 crore, price Rs 324.67, average volume about 357,000 units, good liquidity, expense ratio about 0.60% and one-year tracking error about 0.75%. Currency movement and international-investment limits can affect the tracking difference.
- NSE: GILT5YBEES - Nippon India ETF Nifty 5-year Benchmark Government Security, tracking the Nifty 5-year Benchmark Government Security Index; listed 23 December 2020. It is the stabilising debt sleeve. Price, assets, volume, tracking error and tracking difference should be verified on the purchase date because trading can be thinner than equity ETFs; always use a limit order.
- NSE: GOLDBEES - Nippon India ETF Gold BeES, tracking domestic gold prices; listed 8 March 2007. Assets about Rs 53,341 crore, price Rs 127.17, high liquidity and expense ratio about 0.81%. NSE: SILVERBEES - Nippon India Silver ETF, tracking domestic silver prices; listed 2 February 2022. Assets about Rs 29,499 crore, price Rs 222.78, daily volume about 16.1 million units, high liquidity and expense ratio about 0.58%. Compare each commodity fund with its benchmark and latest factsheet.
For a five-year goal, keep more in Government Securities and less in small-cap, Nasdaq and silver. Seven to ten years suits a balanced mix; fifteen to twenty years gives growth more time to absorb volatility. Invest through an ETF SIP where supported, add gradually during broad market falls, review yearly and rebalance. Simplicity does not remove risk: check the bid-ask spread, indicative net asset value, assets, volume, expense ratio, tracking error and tracking difference before buying. This is educational information, not investment advice.