A Core-Satellite Study of Diversification and Factors
The idea.
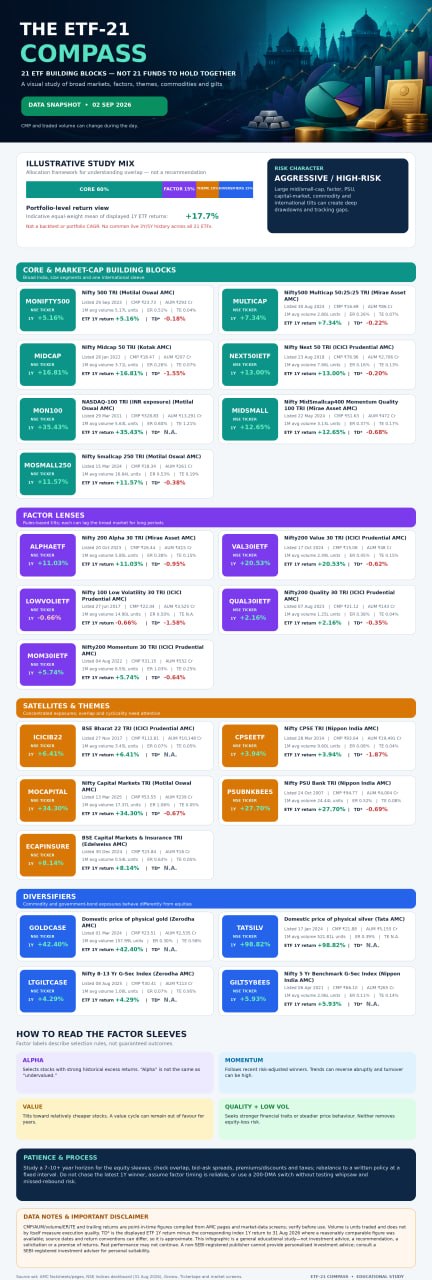
The ETF-21 Compass is a study framework for examining 21 exchange-traded funds across broad Indian equity, market-cap segments, factors, themes, United States equity, precious metals and government bonds. It is a menu of alternatives, not a proposal to own every ticker. More funds do not automatically mean better diversification because underlying holdings can overlap.
Core portfolio (illustrative study weight: 60%).
MONIFTY500 or MULTICAP can represent a broad-market base; NEXT50IETF and MIDCAP add emerging large-company and mid-cap exposure. Owning both broad funds should first be tested for overlap. MON100 is a separate Nasdaq-100 sleeve and introduces technology, currency and overseas-market concentration.
Factor and size laboratory (15%).
ALPHAETF, VAL30IETF, LOWVOLIETF, QUAL30IETF and MOM30IETF apply different rules; MIDSMALL and MOSMALL250 extend exposure towards mid-sized and smaller companies. Alpha is based on historical excess-return characteristics, not necessarily undervaluation. Momentum favours stocks with strong recent risk-adjusted trends. Value looks for cheaper securities; quality screens business strength; low volatility favours relatively steadier stocks. Combining many factors can recreate a broad index while adding cost and complexity.
Satellite and theme sleeve (10%).
ICICIB22, CPSEETF, MOCAPITAL, PSUBNKBEES and ECAPINSURE are concentrated choices. Studying one at a time keeps a theme from quietly dominating the core.
Diversifiers (15%).
A study split could use 10% combined across GOLDCASE and TATSILV plus 5% in either LTGILTCASE or GILT5YBEES. Gold, silver and gilts behave differently from equities, but none is permanently defensive: metals can swing sharply, while longer-duration government bonds react to interest-rate changes.
Historical return check.
NSE total-return data to 31 August 2026 show Nifty 500 at +5.34% over one year, +12.55% three-year CAGR and +11.13% five-year CAGR; Nifty Next 50 at +13.20%, +19.42% and +13.13%; Nifty Midcap 50 at +18.36%, +18.93% and +20.72%; and Nifty 200 Alpha 30 at +11.98%, +18.84% and +15.60%. Comparable one-year ETF observations were approximately MONIFTY500 +5.16%, NEXT50IETF +13.00%, MIDCAP +14.00% and ALPHAETF +11.03%. Different cut-off dates, expenses, tracking difference and corporate actions can change comparisons.
Why no overall CAGR is stated.
Several ETFs are new and do not share a common three- or five-year live history; any result also depends on precise weights, rebalancing dates, cash flows and trading costs. Back-tested index returns are not a live ETF record.
Timing caution.
A 200-day moving-average switch from alpha to momentum can suffer whipsaw, taxes and missed rebounds. It is a research rule, not a proven signal or return guarantee.
Study conclusion and disclosure.
With 85% in equity and thematic sleeves, the illustrated structure is high-risk and would require a long horizon and tolerance for drawdowns. This material is solely for education and general study. It is not investment advice, a recommendation, or an assurance of future return. Consult a SEBI-registered investment adviser before taking any decision.
Sources: NSE Indices August 2026 Index Dashboard and ETF/fund pages accessed on 2 September 2026.